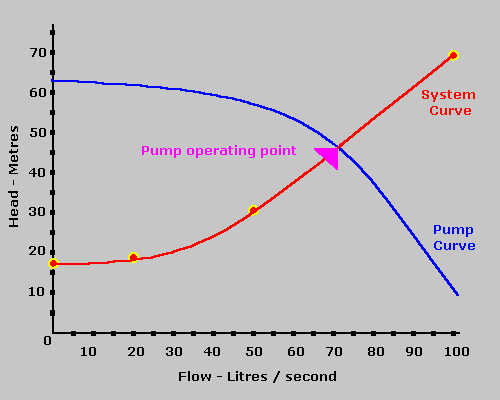
In energy conservation programs for pumps, the performance
characteristics of the pump must be available to pinpoint the location of the
operating conditions in the curve and determine if there are alternative schemes
to lower the power consumption. The standard convention for dynamic
(centrifugal) pump is to draw the pump performance curves showing flow on the
horizontal axis and head generated on the vertical axis. (Refer to the figure
below for a typical pump curve)
When a pump is installed in a system the effect can be
illustrated graphically by superimposing pump and system curves. The operating
point will always be where the two curves intersect. This operating condition
must be located within the region in the curve so that a slight deterioration
of head will improve the pump efficiency, not worsen it.
Adding comfort margins to the calculated system curve to ensure that a sufficiently large pump is selected will generally result in installing an oversized pump, which will operate at an excessive flow rate or in a throttled condition, which increases energy usage and reduces pump life. There are regions in the pump curve where the efficiency is lowest- these are the extremely high head condition and extremely low head condition. In the extremely high head condition, a slight increase in the head will cause the pump to surge, meaning a rapid no flow- high flow condition. In the extreme low head condition, this happens when there is a break in the line so that all resistance, hence the TDH, drops. These conditions must be avoided.
Efficiency, power & NPSH required are also all conventionally shown on the vertical axis, plotted against flow, as illustrated in Fig below. As a generality, the larger the pump, the higher is the efficiency.
